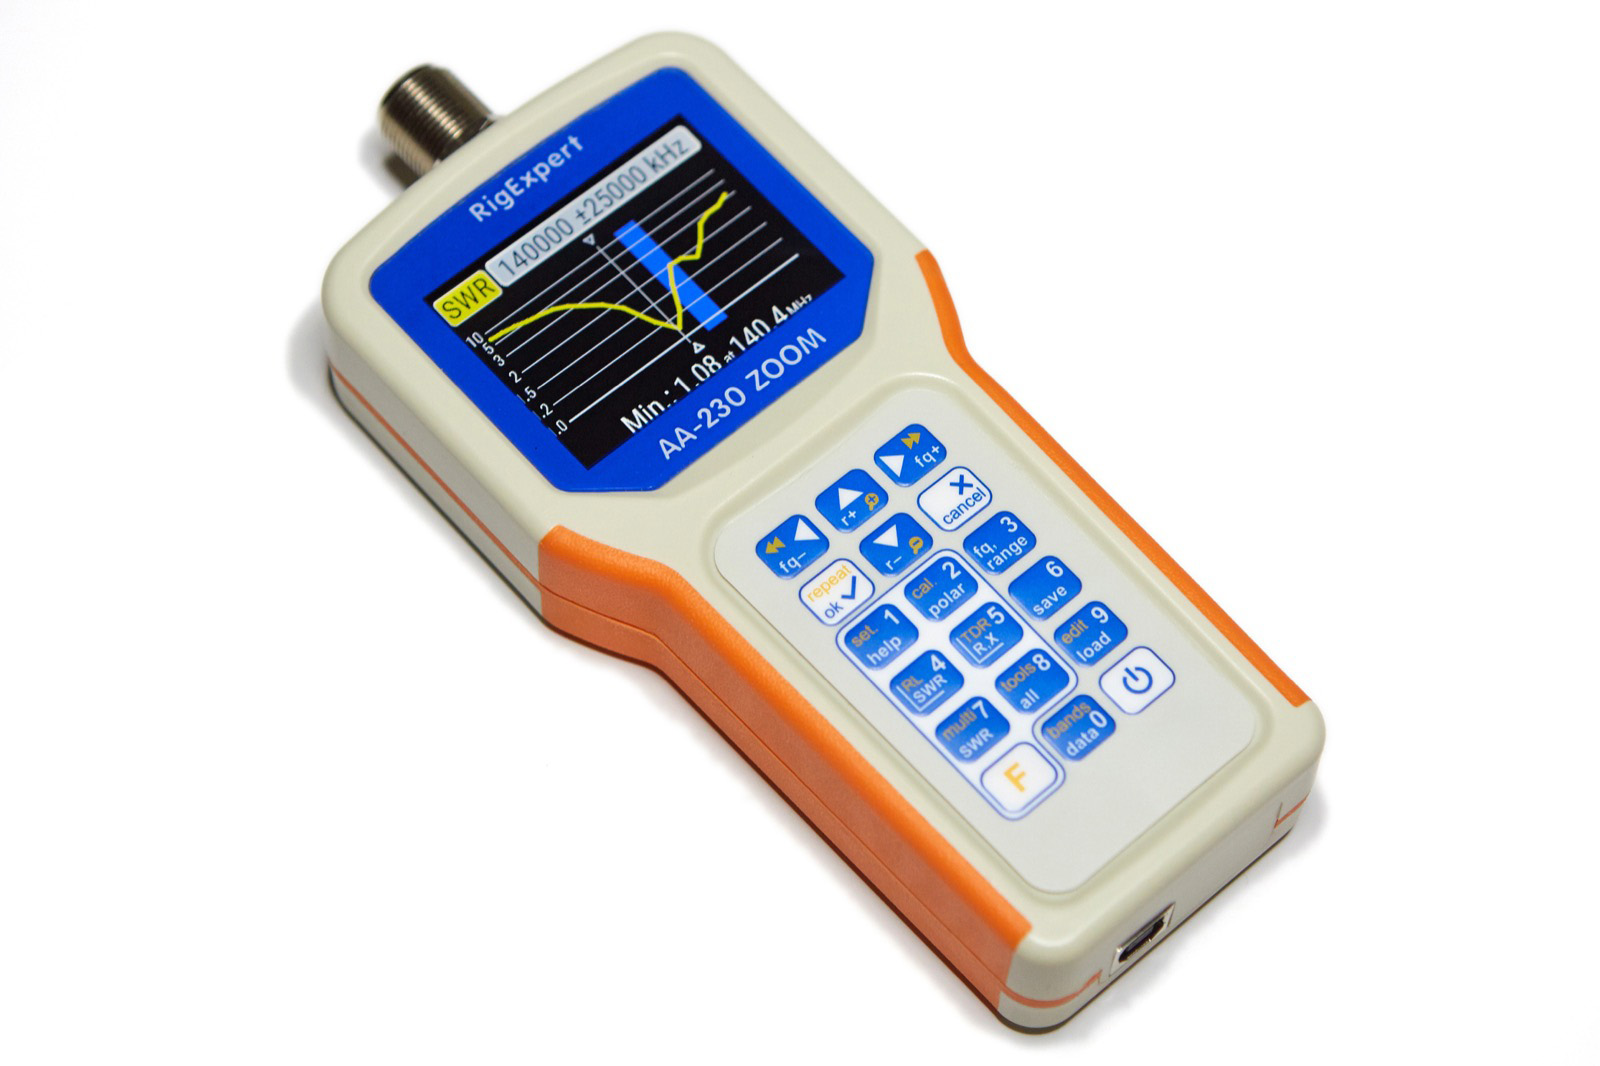
 An antenna analyzer is one of those things that every ham should have, or they should at least know where they can borrow one. Naturally, being a ham for 20 years, I’ve never owned one, but I’d always read great things about RigExpert so when they came out with the new AA-230 Zoom, I decided that this was the analyzer for me. Why the AA-230 Zoom specifically? I’ll tell you why!
The AA-230 Zoom seems to be an odd solution on the surface. The AA-170 covers almost the same range and unless you really need to cover 1.23cm band, why not spend just a little bit more for the fabulous AA-600? Sure the AA-230 Zoom has a great screen and some sort of “zoom” functionality, but the AA-170 is less than half the price, so why not get that one instead? I asked myself those same questions and did some digging. Let’s see what led me to purchasing the AA-230 Zoom over those other choices by comparing the key specs that influenced my decision.
AA-170
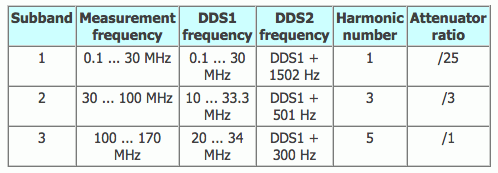 The AA-170 does not generate signals up to 170 MHz natively. Instead it uses measurement frequencies up to 34 MHz (DDS1) and mixes those with set tones and harmonics of the original measurement. My guess is that this is one of the reasons why the AA-170 is so much less expensive than the AA-230 Zoom. This analyzer also has a monochrome screen and a slower processor than the AA-230 Zoom, both of which also likely contribute to the lower price.
AA-600
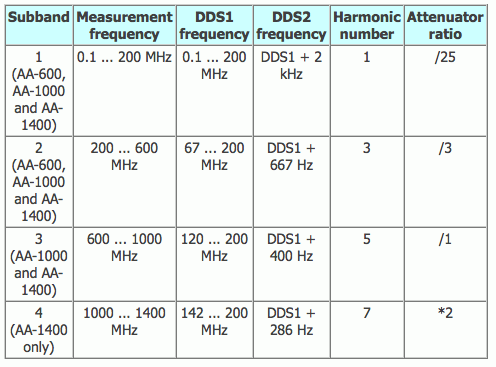 The AA-600 uses a similar technique as the AA-170 to accomplish its greater range, this time using frequencies up to 200 MHz as the DDS1 frequency. With a higher range for DDS1, higher frequencies are possible using harmonics and mixing. In fact, the AA-600, 1000, and 1400 allow extended range by using even higher harmonics than those available natively through the use of the AntScope software.
AA-230 Zoom
From what I can gather from the RigExpert web pages, the AA-230 Zoom does not use harmonic mixing for signal generation, and instead is capable of natively creating signals up to 230 MHz.
The argument could be made that the AA-230 Zoom is akin to an AA-600 without the extended frequency capability afforded by the harmonic mixing technique, so why not get the AA-600 for only a little bit more money?
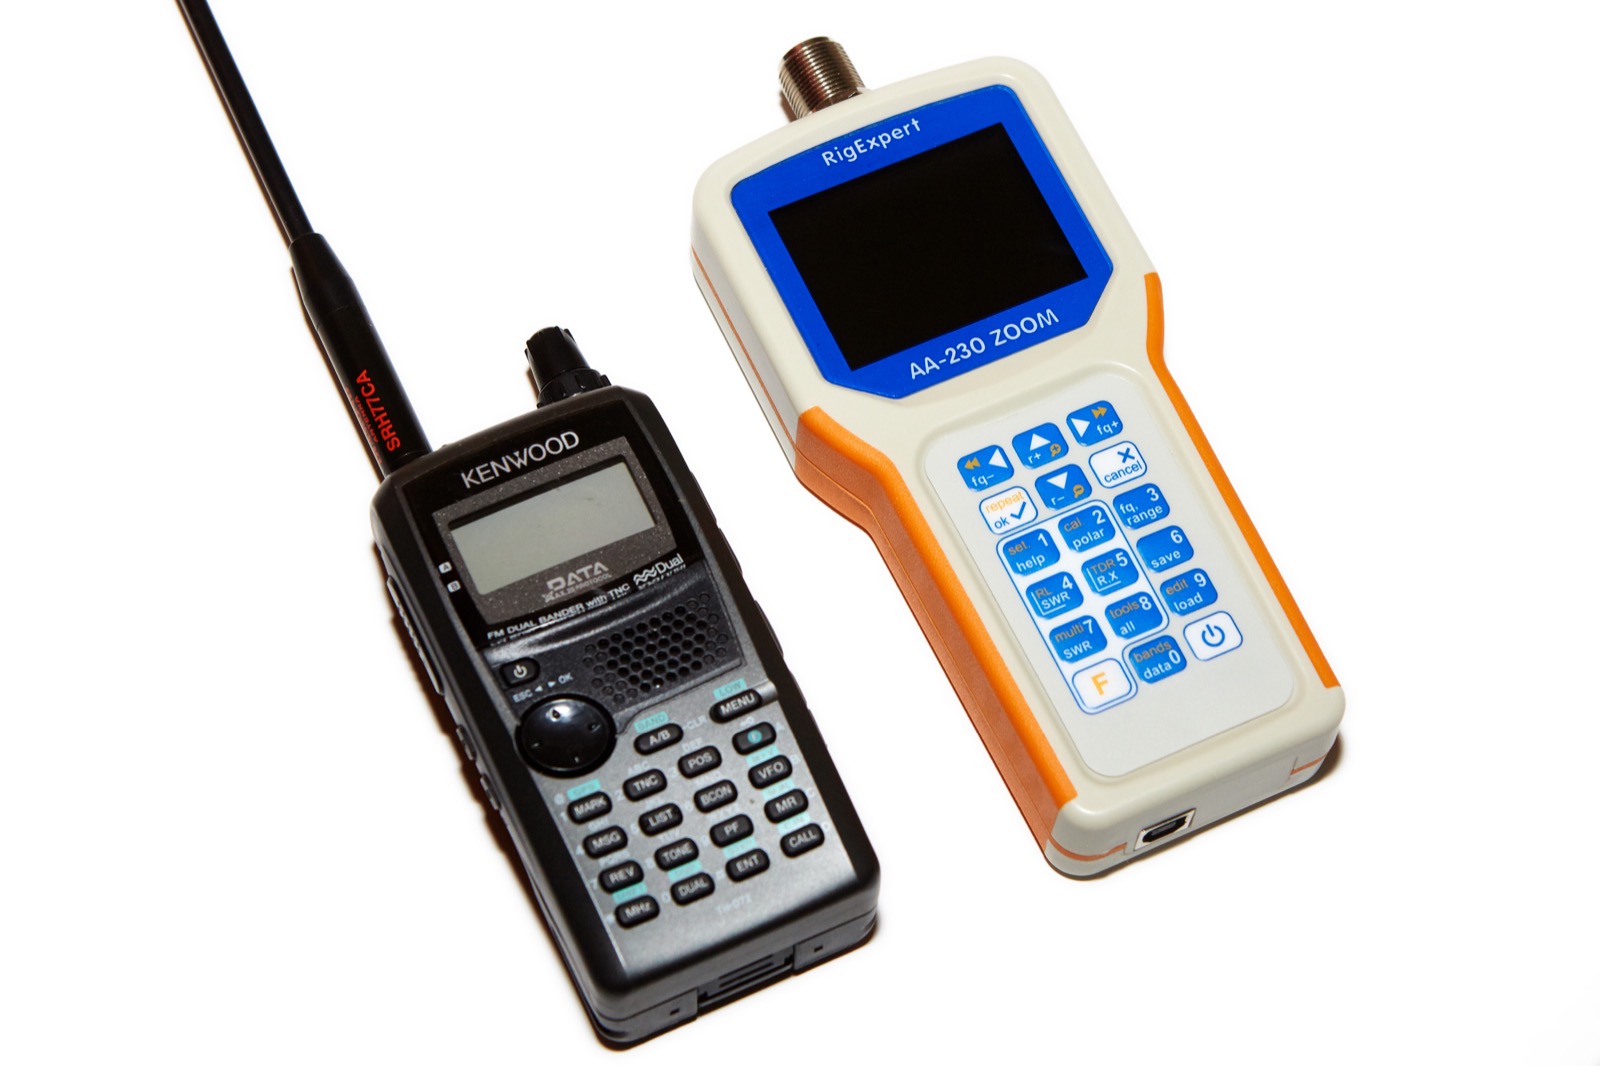 The AA-230 Zoom is substantially smaller than the AA-600, which for me is a pretty important selling point. Additionally, though I do rarely use the 70cm band, I really don’t have a need to measure above the 2M band, so I’m really not getting anything for my money with the bigger, more expensive unit. My needs are primarily HF and 2m.
User Interface
The screen is magnificent. I mean, it’s really nice. It’s dark enough that it has great contrast, but bright enough that you can easily see it outdoors. Whoever designed the screen on this thing should get a raise.
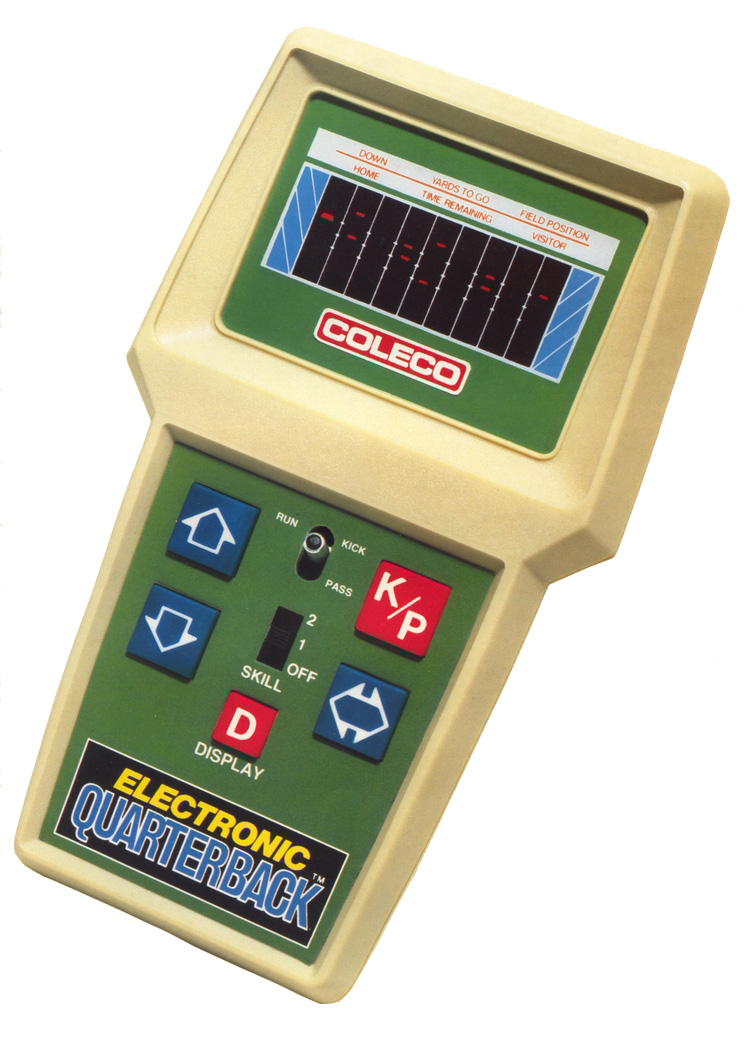 As a fun aside, it sounds like a 1980s video game when you turn it on and push the buttons. Hell, it even kind of resembles an old Coleco Electronic Quarterback game!
The user interface is pretty intuitive, which is a good thing because while the manual is useful and explains how most of the features work, it doesn’t explain why you’d want to perform these tests. To be fair, the manual is easy to read and is very straightforward, and in this day of terrible manuals, it’s refreshing to have one that isn’t riddled with bad grammar thanks to poor translations. The fact that the AA-230 Zoom is easy to use is the reason that the manual is so simple, and that’s a good thing.
What I might like to see in the manual is a brief section on how to use an analyzer like this. For example, reading a Smith Chart is not terribly intuitive, and though the material is covered in the amateur radio Extra exam in the US, passing the test doesn’t automatically mean you get the concepts. Still, that may be an unfair thing to complain about since I didn’t buy a class, I bought an analyzer. It’s pretty fair for RigExpert to assume I know what I’m trying to analyze.
Smith Chart
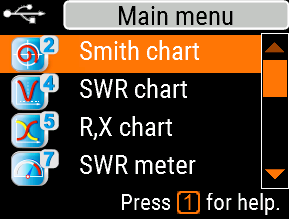 Speaking of Smith charts, generating one is the first option on the analyzer’s on-screen menu, followed by SWR Chart, R,X chart, SWR meter, All Params, Setup, RL chart, TDR chart, MultiSWR, and Tools. Let’s take a quick look at each.
If you don’t know how to read a Smith chart, you’re probably not alone. There was a fair bit of material about the math involved on the amateur radio Extra exam, but in my opinion understanding the math behind the charts is not necessary to using the charts successfully when analyzing your antenna — at least not with a cool tool like the AA-230 Zoom.
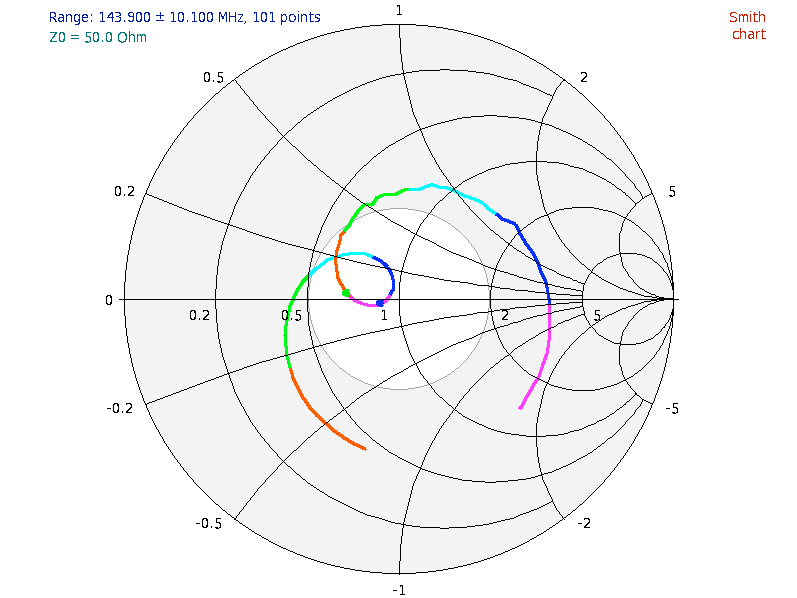
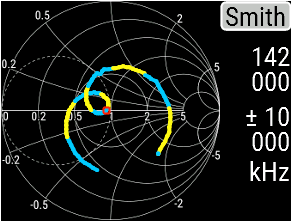 One of the best things I’ve seen about reading Smith charts is this video by Antenna Theory.com. It starts off with some math that may hurt your head if you don’t like the idea of imaginary numbers, but hang in there until about the 7:40 mark where it all clicked for me. That’s when I realized that the little red circle on the AA-230 Zoom’s Smith chart indicated that my Diamond X50 seems to be resonant at 50Ω right around the 142 MHz mark. The arrow keys let you move that red circle to see what frequent is being represented at various points on the plot.
SWR Chart
 Next is the SWR chart mode. In this mode, the analyzer will plot the SWR values across a range of specified frequencies. Note that most of these tools can be given a specified range by using the [fq. range] button (3).
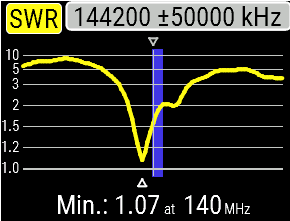
In this mode, the ham radio bands will be highlighted in blue (or yellow in the AntScope software) so that you can quickly see if your antenna is tuned the way you want. In fact, you can see in the first example that my Larson NMO2/70B needs to be tuned since it it’s lowest SWR measurement is at 140 MHz which is outside of the US 2M band (144-148 MHz).
 In the second example I’ve scanned my magnet mount Cushcraft CS-270 that I’ve probably had for 20 years. From an SWR standpoint, that rusty old thing is spot on with the lowest SWR reading right smack in the middle of the US 2m band.
You can easily change the nationality of these bands in the Setup menu. Available options as of firmware v1.4 are Europe & Africa, Americas, Asia & Oceana, and None (for no highlighting of bands). You may also change the colors on the screen and the units between imperial and metric as well as a variety of other options such as cable velocity factor and the number of data points.
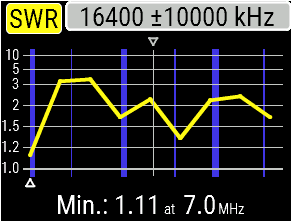 Here is another chart, this time reporting on the SWR of multiple ham bands on my seven-band off-center-fed dipole antenna. This is a great example because you can see how the multi-band antenna behaves when transmitting on various bands. The 40M band is the left-most blue line which is showing about a 1.2 SWR. There is a small line to the right of that which represents 30 meters (about 3 SWR), then 20M (about 1.7 SWR), and so-on. This quick look into the SWR of multiple bands on a single antenna is a very powerful tool. Again, the arrow keys can be used to move the white line and triangle left and right. The value of the frequency where this line occurs is reported on the top of the screen while the minimum SWR for the scan is reported on the bottom.
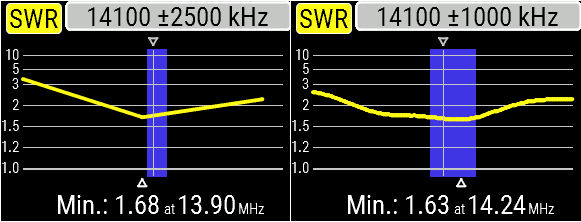 By the way, if you’ve wondered what the “zoom” in AA-230 Zoom represents, it’s the ability to zoom in and out of any of these charts even as measurements are taking place. Here’s the same chart zoomed into the 20M band. Note that when zoomed out wide there are less data points included over the smaller range, so if you zoom into a wide chart, eventually you’ll zoom beyond the resolution of the chart at which point you’ll need to re-scan. The left chart shows a zoom of the previous chart. Since there are fewer data points in the shown range (only one on-screen and two just off-screen), the chart is very angular. The right example shows a similar range (a little tighter, actually) but with this range containing all the data points which results in a much smoother chart. Basically, if you want detailed data, you’ll need to zoom in before you scan.
R/X Impedance
 Next on the main menu is the R,X mode which reports the real/imaginary (R/X) impedance of an antenna or cable. This tool can be used to figure out the length of a cable, as well as where any faults in a cable might be. though the TDR mode is easier for these purposes. It can also be used to measure the characteristic impedance of a cable. In fact, the analyzer can be used to measure capacitance and inductance using this mode, but the manual advises that this is “not the main purpose of RigExpert Analyzers” (RigExpert AA-30 Zoom Manual, pg. 21). In this example I’ve turned off the ham band indicators and run the test on a short cable with the end closed.
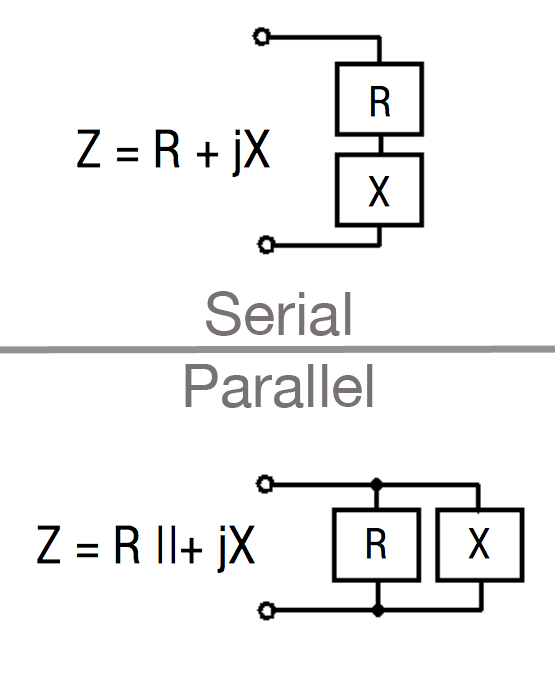 The impedance reported by the analyzer may be represented in one of two ways; serial or parallel. The result shown here use the series model for load, which can be changed to the parallel model using the [Function][1] key combination. In the series mode, impedance is expressed as the two measurements resistance and reactance in series, while the parallel mode obviously expresses them in parallel. These two differing views are shown to the right including the formulas used to derive Z.
This change in the way in which impedance can be expressed is adjustable both on the RX tool and the All Params tool, which we’ll see in just a bit.
SWR Meter
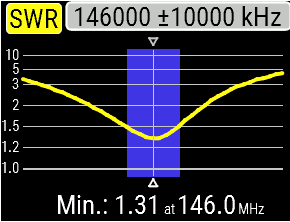
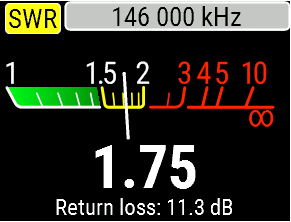 Option 7 on the main menu is the SWR meter. This excellent tool allows you to enter a frequency for which the AA-230 Zoom will report the SWR after hitting [OK]. In this example I’m using the same antenna from the SWR chart example that is slightly out of tune, which shows an SWR of 1.75 at 146 MHz. This tool stays running until you cancel it so you can see directly what any changes to your antenna have in real time. This is a great tool because you don’t need to inject any power or signal into the antenna like you would with a typical SWR meter that goes inline between the transmitter and antenna. With the analyzer connected to the antenna, just run this mode, adjust the antenna and watch the results in real time.
As an aside, this mode is fun to show people how SWR can be affected by things like changing ground planes, touching the antenna, and moving a loose PL-239 connector, all without the risk of RF burns from doing the same thing with a transmitter attached.
All Params
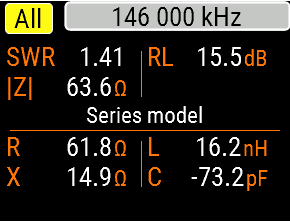 Next on the menu is the All Params tool. This tool shows direct data for SWR, Return Loss (RL), impedance (Z), Resistance (R), reactance (X), inductance (L), and Capacitance (C). This is a great screen if you prefer raw data to pretty charts and graphs. Once started, this tool will run continuously until canceled.
Again, when you see a frequency listed then the tool is testing for that setting and the setting can be changed on the fly with the arrow keys or by pressing the [fq. range](3) key.
RL Chart
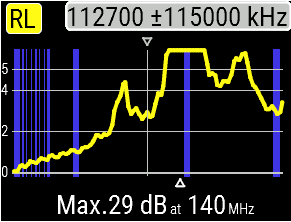 RL chart is main menu option F4, and it doesn’t appear anywhere in my manual or in the manual I downloaded from the RigExpert website. My assumption is that this tool reports on Return Loss for a given frequency or range. The output shown to the right is the RL Chart for my Diamond X50 2m/70cm antenna. Since an increased RL corresponds to a lower SWR and this antenna reports a maximum RL right smack in the 2M band, I’d say my assumption stands to reason.
Multi-SWR
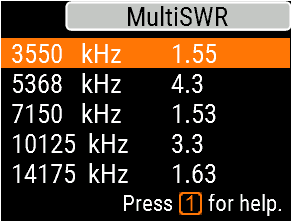 MultiSWR mode (F7 on the main menu) will report the SWR measurements for multiple specific frequencies at once. Here, I’ve hooked the AA-230 Zoom up to my Buckmaster seven-band off-center-fed dipole antenna and as expected, you can see that it has better SWR on some bands than others. It’s pretty darn good on 80m, not so great on 60m, back to pretty darn good on 40m and so-on. This is a pretty cool tool and what’s nice about it is that it’s a very fast updating screen compared to the SWR chart which scans hundreds of frequencies in order to produce a nice plot of the range.
Tools – Cable Impedance
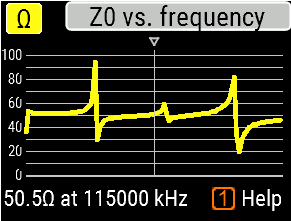 Under menu F8 (Tools), the AA-230 Zoom will measure Cable Loss, Cable Impedance, and run self tests. The first output to the right is the result of running a Cable Impedance test on short piece of Cable Experts 1318FX cable. The second is the same test on a short piece of RG-213/U with DX Engineering silver-plated PL-239s that I soldered on. Note that running this tests takes two steps.
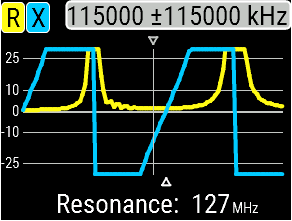
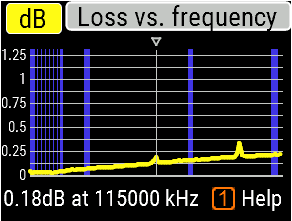
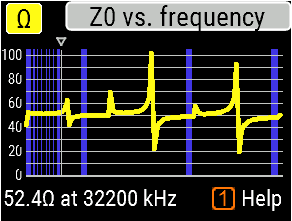 First the analyzer will instruct you to connect an unterminated cable and run test 1/1. When that is complete, the analyzer will have you short the far end of the cable after which is will run test 2/2. The final result is a chart similar to what you see here. By using the arrow keys, you can move the vertical line to the left and right which will report the impedance of the cable at the specified frequency, which in the first example is centered at 115 MHz. The second example shows the line at 52.4Ω at 32.3MHz. The second example also shows the US ham bands in blue.
Tools – Cable Loss
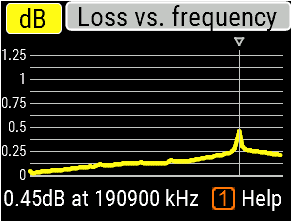 The Cable Loss tool under the Tools section will update together with the Cable Impedance test (and vice-versa). In other words, you do not need to run both tests; if you run one, the data will be populated for both charts.
On the first output sample I’ve used the arrow keys so that the cursor is positioned over the hump showing the maximum loss, which according to the chart is at 190.9 MHz. Reading the output carefully, this maximum loss is only 0.5dB, and since this is only about a one meter cable, I’m not too worried about it.
 The second example includes the US ham bands and is again testing my home-made RG-213/U cable. I think it’s cool to be able to visualize the increased loss behavior at higher frequencies as well as how the two cables have slightly different loss characteristics at all frequencies.
TDR
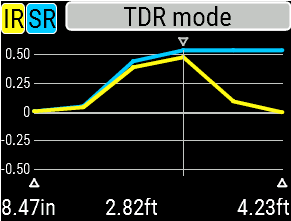 TDR Mode (F6 on the main menu) is the Time Domain Reflectometer. A TDR measures how long it takes for a pulse to bounce off of the far end of the cable given the known cable velocity and the speed of light. By doing this, a TDR can measure how long the cable is, or if broken, where the break is. The AA-230 Zoom actually uses a different approach called Frequency Domain Reflectometry where the Impulse Response (IR) and Step Response (SR) is measured based on the Real and Imaginary (R/X) impedance results collected over the entire frequency range.
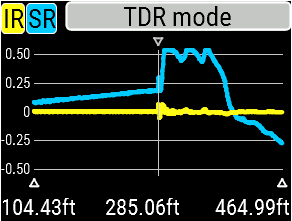 If that’s all too technical for you, just know that I plugged a roughly three foot cable into my analyzer, ran the TDR test, after which the AA-230 Zoom showed me the chart reporting that my cable was 2.82 feet in length. Here’s another plot that resulted from me using the TDR function on the long run from my house to the dipole in the woods which reports a length of 285.06 feet.
The downside of this tool is that it takes almost a minute to run (56 seconds when I timed it). Being a network guy, I use TDRs all the time on Ethernet cables and those testers usually produce instantaneous results which makes using this vastly more expensive tool a bit frustrating. Still, it works and it seems to work well even if I do have to wait a whole minute. I blame the Internet for my newfound lack of patience.
Software
I’ve been in IT since before companies had IT departments. I also run a Mac and, in fact, my house is populated with a variety of Macs and Linux boxes. Sadly much of the ham radio community seems stuck in the days when Windows XP was state of the art, and it’s rare to find software that runs on a Mac. As a Mac and Linux lover, all I can say is that this state of affairs sucks.
Though the website for the AA-230 has Mac and Linux sections, they both require Wine or Wine Bottler to work. What that means is that there is no native Mac software from RigExpert for the analyzers. What’s worse, in order to make the analyzer work with the software, a USB-serial driver (not a cable) must be installed, so now we’ve got Windows software running in a VM or an emulator with an additional layer of nonsense that converts modern USB to archaic serial jammed in the middle of it all. This, plainly stated, sucks more.
Installation Frustrations
 I didn’t need Wine because I have Fusion, or so I thought. Well, the software loaded but the driver refused to work with the software, even though the troubleshooting app saw the AA-230 Zoom. The AA-230 troubleshooting page said to overwrite the EEPROM on the analyzer with the EEFTDI.exe program downloaded from their page. Their page didn’t have it, and instead said to go to the FTDI drivers page. Guess what? It wasn’t there either. So I downloaded the latest driver for what appears to be the right chip. Nope. Nothing. No dice.
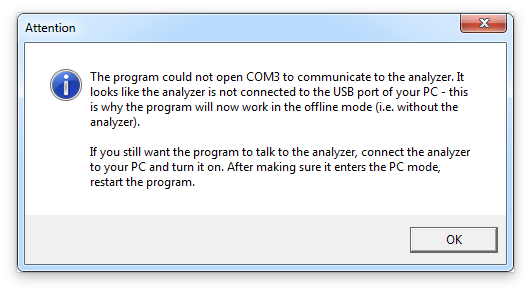
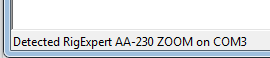 The best part? Check out the status message from the AntScope’s status bar during this stage of my testing. The software reported that it detected the AA-230 Zoom — but it DIDN’T FRAKKING WORK! Deep breath…
Since I bought the analyzer from an authorized dealer, they opened a ticket for me. The support process was a bit drawn out since RigExpert in the Ukraine and I’m in the US, but we got the Analyzer upgraded from Firmware v1.1 to v1.4 by manually putting the device into the proper mode. I then had to upgrade the USB/Serial driver on my Mac. As it turns out, there is already a USB/Serial driver (kernel extension, technically) on OSX 10.10.5 (Yosemite). This command shows that the installed version of that driver is 1.0.1b16. This page gives some history of this driver which has been part of OSX since Mavericks.
GADs-Mac-Pro:~ GAD$ kextstat | grep FT
  167    0 0xffffff7f831d1000 0x7000     0x7000     com.apple.driver.AppleUSBFTDI (1.0.1b16) <116 38 5 4 3>
I downloaded the latest driver from the website referenced on the RigExpert troubleshooting page and installed it, after which my Mac reported that there were now two FTDI USB/Serial extensions installed.
GADs-Mac-Pro:~ GAD$ kextstat | grep FT
   167    0 0xffffff7f831d1000 0x7000     0x7000     com.apple.driver.AppleUSBFTDI (1.0.1b16) <116 38 5 4 3>
   168    0 0xffffff7f83213000 0x8000     0x8000     com.FTDI.driver.FTDIUSBSerialDriver (2.2.18) <116 38 5 4 3 1>
This fixed the Mac connectivity problem and thus allowed the RigExpert Firmware update tool to read and write to the analyzer. Success!
After that, running AntScope through Wine worked like a charm. It did not, however, seem to work through Fusion. I could also not get WineBottler to work. Grumble…
I should note that there are alternatives to RigExperts AntScope software if you’re on a Mac. AAScope looks promising, but I couldn’t get it to work on my Mac due to the previously complained about obnoxious USB/serial conversion issues. I then tried it on one of my other Macs, but I hadn’t updated the FTDI driver on that one and gave up in a huff of frustration.
Features
Everything you can do from the analyzer’s front panel can also be done through the software with a couple of additions. For example the screenshots of the analyzer’s screen on this page were done by screen-capturing the analyzer through the AntScope software. This is a fabulous tool for documenting how-to guides or even just for documenting what you’ve measured. Really, though, if you’re printing you’d probably want to grab the graphs from the software. These charts are more detailed and have a much higher resolution but perhaps most importantly, they are generated on a white background which makes a lot more sense when printing.
 Where the Analyzer lets you cycle though the sampling points using arrows, the AntScope software will show data as you hover your cursor over specific points in whatever graph you’re viewing. Not only that, but the detail presented in the software covers all measurements regardless of the graph being viewed. Of course the graphs on the software are much larger and scalable so they they are much more valuable for things like reports and blogs. Just click on the two smith charts to see how much larger the second one is, and the software will make them even larger!
For my uses, the analyzer itself is more than sufficient for 90% of my needs, this blog being one obvious exception.
Summary
The AA-230 Zoom analyzer is a fantastic tool, and I’m quite happy with it overall. If I could improve anything on the analyzer itself it would be to somehow backlight the keys, but I know that would probably kill the battery life and I’d chose battery life over backlights every time. Besides, I always have a flashlight in my pocket, though having to pull that out while I’m on a ladder can be kind of a problem. Then again, I’m not likely to be up on a ladder in the dark.
The analyzer has an N-type connector on it, and mine came with an N-SO239 adapter. While I think that the N connector is a great innovation and I agree that we should all upgrade to it wherever possible, the fact remains that all of my HF and mobile radios, three of which where bought in 2015, have SO-239 connectors on them. I detest adapters, and when measuring SWR things like loose connectors can be a problem — a problem potentially exacerbated by an adapter in the path. Still, if more devices came with N connectors maybe it would get us all to change.
The fact that the analyzer uses USB is great. The fact that it needs to be converted to serial (in software) for the software to work is terrible. The fact that the software only runs on Windows just adds insult to injury for we Mac and Linux users.
The AA-230 Zoom itself, though, is so good, and so great to use that my small complaints are all but forgotten.
Would I recommend the AA-230 Zoom for your ham radio antenna analytic needs? Absolutely! Just beware that the software can be a bit clunky especially if Windows isn’t your OS of choice.
If you plan to use the analyzer while hooked up to your computer for the majority of the time, this may not be the best solution, especially if you’re on a Mac. If, like me, you anticipate using this in cars, in the woods, or up on ladders, I think it’s a stellar device.
For what this device costs, I would have liked to see it come with a case or at least a nice ballistic nylon pouch. Maybe I’ll get a nice Nanuk or Pelican case to put it in.
I have to wonder if they’ll be coming out with an updated version of the AA-600 (not to mention the AA-1000 and AA-1400) with a similar case design and zoom designation, but then I still wouldn’t really need anything over 2m. Even if they do, this will still likely be the right choice for me.
73 DE K2GAD AR
Donate: PayPal Crypto:
ETH: 0x0AC57f8e0A49dc06Ed4f7926d169342ec4FCd461
Doge: DFWpLqMr6QF67t4wRzvTtNd8UDwjGTQBGs